CUET Preparation Today
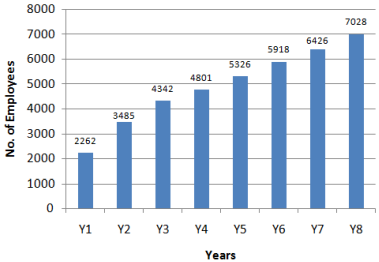
The Bar graph shown below presents the number of employees in an office during eight consecutive years.
What is the average number of employees per year? |
5148.5 5348.5 5548.5 4948.5 |
4948.5 |
⇒ Average number of employees = \(\frac{2262 + 3485 + 4342 + 4801+5326+5918+6426+7028 }{8}\) = \(\frac{ 39588 }{8}\) = 4948.5 |