CUET Preparation Today
Study the given bar-graph and answer the question that follows.
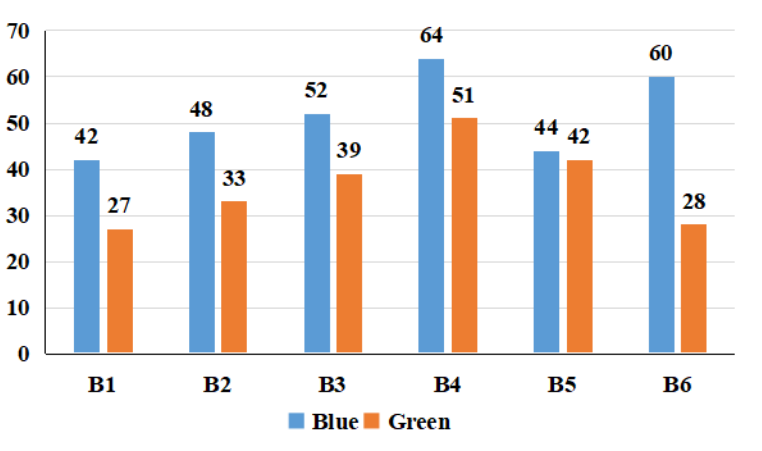
The total number of blue pens sold on that day of all the six brands taken together is how much percentage more than the total number of green pens sold on that day of all the brands taken together? [Give your answer correct to 1 decimal place.] |
46.5% 40.9% 44.7% 47.5% |
40.9% |
Total number of blue pens = 42 + 48 + 52 + 64 + 44 + 60 = 310 Total number of Green pens = 27 + 33 + 39 + 51 + 42 + 28 = 220 Required percentage = \(\frac{310 - 220 }{220}\) × 100 = \(\frac{90}{220}\) × 100 = 40.9% |