CUET Preparation Today
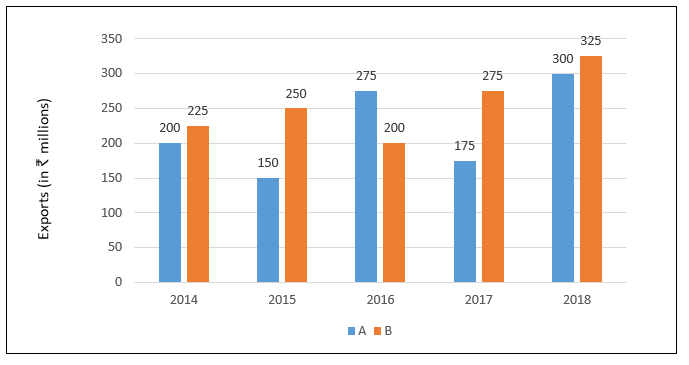
The following bar graph shows exports of cars of type A and B (in millions) from 2014 to 2018.
What is the ratio of the total exports of cars of type A in 2014 and 2017 to the total exports of cars of type B in 2015 and 2016? |
10 : 9 5 : 6 11 : 10 3 : 2 |
5 : 6 |
Export of car A in 2014& 2017 : Export of car B in 2015 & 2016 (200+175) : ( 250+200) 375 : 450 5 : 6 |