CUET Preparation Today
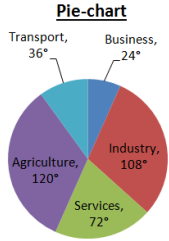
The Pie Chart shows the angular representation of five different Employment sectors. The total number of employees in these five sectors is 7,20,000.
How much percent employees are in Service Sector? |
72% 36% 20% 25% |
20% |
Percentage of employees in service sector = \(\frac{72 }{360}\) × 100 = 20% |