CUET Preparation Today
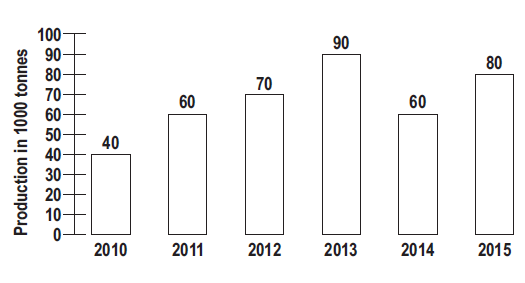
The bar chart shows the production of sugar by a company (in 1000 tons) over 6 years 2010 to 2015.
Find ratio of production increase in year 2013 to the production increase in year 2012 compared to their respective previous year. |
12 : 7 13 : 15 7 : 12 4 : 5 |
12 : 7 |
Percentage increase in the production of sugar of year 2013 = \(\frac{90 - 70}{70}\) × 100 = \(\frac{200}{7}\)% Percentage increase in the production of sugar of year 2012 = \(\frac{70 - 60}{60}\) × 100 = \(\frac{100}{6}\)% Ratio → \(\frac{200}{7}\)% : \(\frac{100}{6}\)% 12 : 7 |