CUET Preparation Today
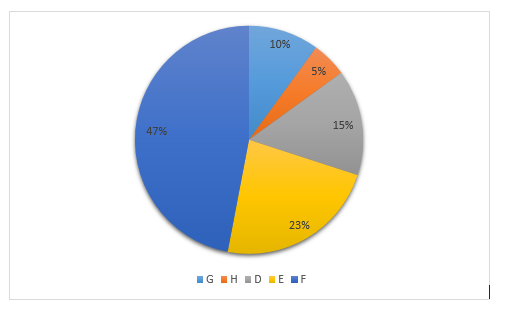
The pie chart given below show the runs scored by 5 batsman in a cricket match. Total runs scored by these batsman are 400. Runs scored by a batsman is shown as a percentage of runs by all these five batsman.
What is the ratio of runs scored by D to the runs scored by H ? |
1 : 5 4 : 1 1 : 3 3 : 1 |
3 : 1 |
Runs of D : Runs of H 15 : 5 3 : 1 |