CUET Preparation Today
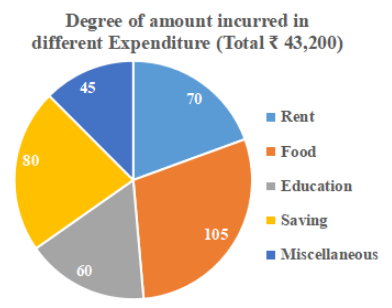
The given Pie-Chart shows the degree wise breakup of expenditure of a family in a month. Total income of a family is ₹43200.
The amount spent on food is what percent of the savings and miscellaneous expenses? |
84% 60% 75% 90% |
84% |
Required percentage = \(\frac{105}{80 + 45}\) × 100 = \(\frac{105}{125}\) × 100 = 84% |