CUET Preparation Today
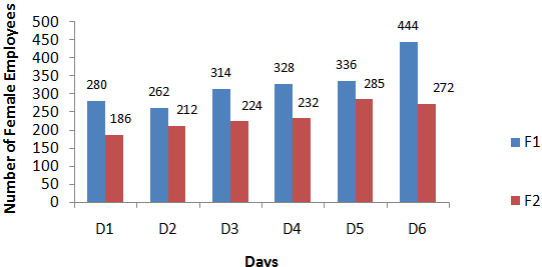
The Bar graph given below presents the number of female employees working in two factories on six different days of a week.
What is the ratio of the average number of females working in factory F2 per day during Days D1, D2, D3 to the average number of females working in factory F1 per day during days D4, D5, D6? |
1964 : 1411 311 : 554 1411 : 1964 554: 311 |
311 : 554 |
Average female working in F2 on D1 , D2 & D3 : Average female working in F1 on D4 , D5 & D6 \(\frac{186 + 212 + 224}{3}\) : \(\frac{328 + 336 + 444}{3}\) 622 : 1108 311 : 554 |