CUET Preparation Today
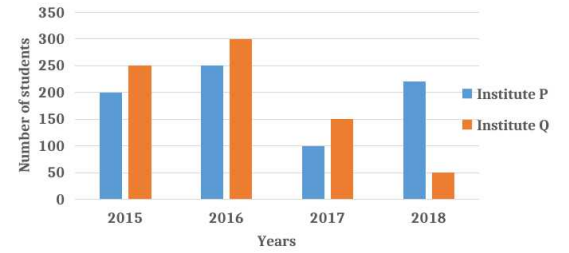
The given graph shows the number of students who passed SSC in two institutes (P and Q) during four years.
What is the difference between the average number of students who passed in institute P in 2015 and 2016 and that in institute Q in 20 17 and 2018? |
200 275 125 150 |
125 |
Average number of students passed from P in 2015 & 2016 = \(\frac{200+250}{2}\) = 225 Average number of students passed from Q in 2017 & 2018 = \(\frac{150 + 50 }{2}\) = 100 Required difference = 225 - 100 = 125 |