CUET Preparation Today
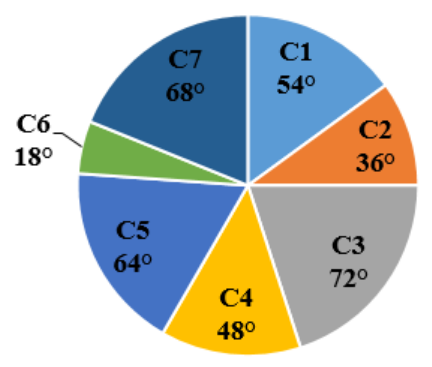
The following pie chart shows the sectors representing the shares of the number of electric buses manufactured in each of 7 different colours in a given year in terms of the central angles (in degrees) with respect to the total number of buses manufactured during that year of all the 7 colours taken together.
What is the difference in the percentage shares of buses of C4 and C6? [Give your answer correct to 2 decimal places.] |
11.11% 8.33% 9.09% 12.5% |
8.33% |
Difference in number of buses of C4 & C6 = \(\frac{48-18 }{360}\) × 100 = \(\frac{30}{360}\) × 100 = 8.33% |