CUET Preparation Today
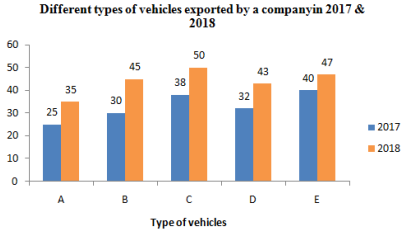
The given Bar Graph presents the number of different types of vehicles exported by a company in 2017 and 2018.
The average export of vehicles in 2018 is what percent more than the export of vehicle A in 2017? |
$46\frac{2}{3}$ 68 $37\frac{1}{2}$ 76 |
76 |
Average export of vehicles in 2018 = \(\frac{35+45+50+43+47 }{5}\) = \(\frac{ 220 }{5}\) = 44 Export of vehicle A in 2017 = 25 Required percentage = \(\frac{44 - 25 }{24}\) × 100 = \(\frac{19 }{25}\) × 100 = 76% |