CUET Preparation Today
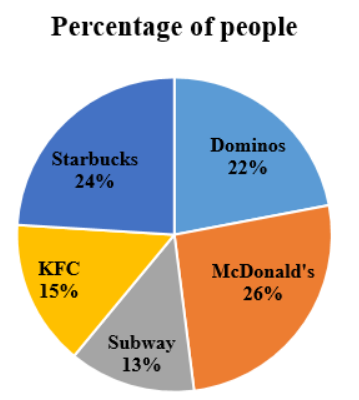
A survey was conducted among 3000 people to find the chain of cafes that was most popular. The following pie chart shows the distribution of the percentage of people according to the choice of their favourite cafe.
Find the ratio of the number of the people who selected the most popular among the given cafe chains as their favourite to the number of the people who selected the least popular among the given cafe chains as their favourite. |
2 : 1 1 : 3 1 : 2 3 : 1 |
2 : 1 |
Most popular among all the cafe is = McDonald's Least popular among all the cafe is = Subway Most popular cafe : Least popular cafe 26% : 13% 2 : 1 |