CUET Preparation Today
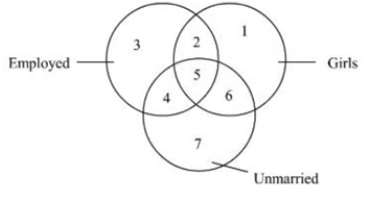
Given below is the diagram with numbers for shapes representing employed, girls and unmarried.
|
Identify the region representing the group who are employed as well as unmarried. |
1 3 4 5 |
4 |
From the above figure we conclude that 4 is the number of the group who are employed as well as unmarried. |