CUET Preparation Today
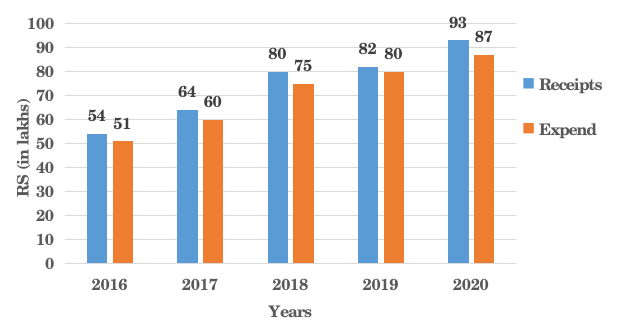
The following bar graph shows receipts and expenditure by a business firm over 5 years. Gain = Receipts - Expenditure. In which year did the company gain the minimum amount?
|
2016 2017 2019 2018 |
2019 |
Gain = Receipts - Expenditure Gain of 2016 = 54 - 51 = 3 Gain of 2017 = 64 - 60 = 4 Gain of 2018 = 80 - 75 = 5 Gain of 2019 = 82 - 80 = 2 So , 2019 has minimum gain. |