CUET Preparation Today
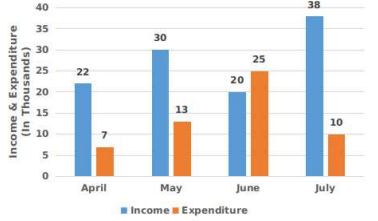
The given bar graph represents the income and expenditure of a person during the four consecutive months, April to July, 2019.
What is the percentage of the total expenditure of the total income? |
40% 50% 30% 20% |
50% |
Total Income = 22+30 + 20 + 38 = 110 thousand Total Expenditure = 7 + 13 + 25 10 = 55 thousand Required percentage = \(\frac{550 }{1100}\) × 100 = 50% |