
According to species-area relationships, the relation between species richness and area for a wide variety of taxa (angiosperms, birds, bats and freshwater fishes) turns out to be a:
Answer & explanation
Correct answer: option 3
The correct answer is Option (3) → Rectangular hyperbola
As a larger area is explored, the number of species found rises, but only up to a limit. Plotted on ordinary graph paper, this gives a curve that climbs steeply at first and then flattens. On a logarithmic scale, the same relation becomes a straight line: log S = log C + Z log A.
Option (1) Rectangular parabola — Incorrect. There is no such curve as a “rectangular parabola”.
Option (2) Ellipse — Incorrect. An ellipse is a closed oval curve. It would mean that species richness falls again as the area grows, which does not happen.
Option (3) Rectangular hyperbola — Correct. This curve rises fast and then levels off, which is how species richness grows with area.
Option (4) Linear hyperbola — Incorrect. There is no such curve as a “linear hyperbola”. The relation becomes linear only on a logarithmic scale, and then it is a straight line, not a hyperbola.
NCERT Extract:
Patterns of Biodiversity – “… (ii) Species-Area relationships : During his pioneering and extensive explorations in the wilderness of South American jungles, the great German naturalist and geographer Alexander von Humboldt observed that within a region species richness increased with increasing explored area, but only up to a limit. In fact, the relation between species richness and area for a wide variety of taxa (angiosperm plants, birds, bats, freshwater fishes) turns out to be a rectangular hyperbola (Figure13.2).”
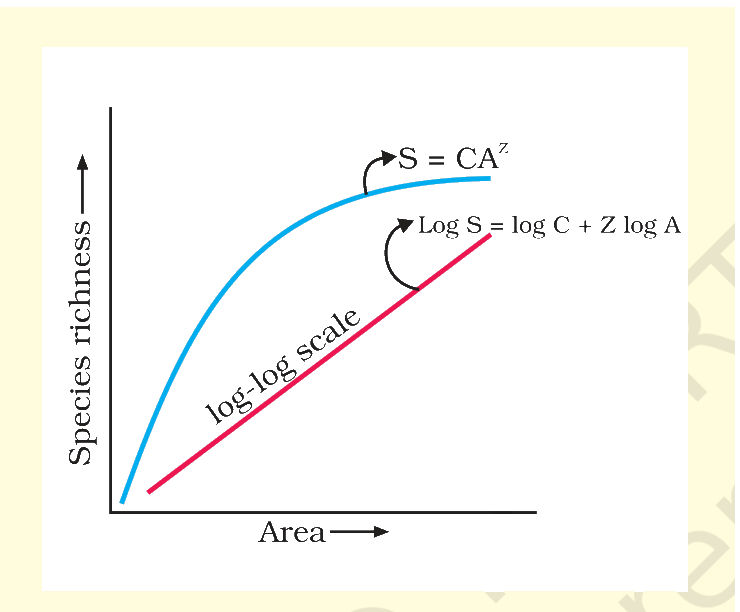
Figure 13.2 Showing species area relationship. Note that on log scale the relationship becomes linear