CUET Preparation Today
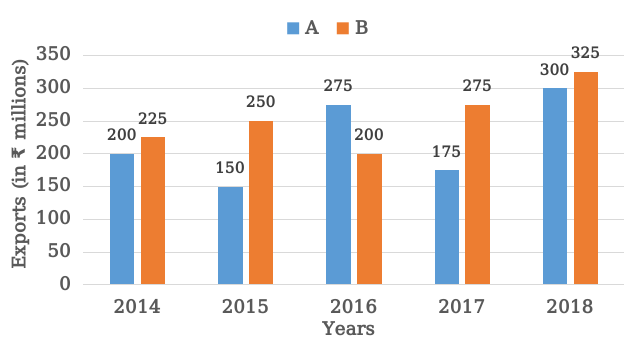
The given bar graph shows exports of cars of type A and B (in ₹ millions) from 2014 to 2018. Study me graph and answer me question that follows.
What is the ratio of the total exports of cars of type A in 2014 and 2018 to the total exports of cars of type B in 2015 and 2017? |
20 : 21 10 : 9 5 : 4 13 : 12 |
20 : 21 |
Export of car A in 2014 & 2018 : Export of car B in 2015 & 2017 ( 200 + 300 ) : ( 250 + 275 ) 500 : 525 20 : 21 |