CUET Preparation Today
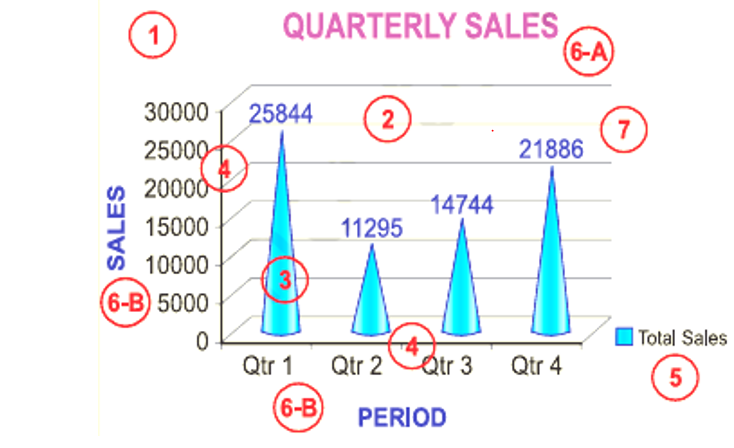
What does number 3 depict int he given figure? |
The plot area A data label A chart and axes titles The data points |
The data points |
The correct answer is option 4- The data points. The data points are depicted at number 3 in the given figure. The data points: Individual values plotted in a chart and represented by bars, columns, lines, pie or various other shapes are called data markers. Data markers of the same colour constitute a data series. The data series are related data points that are plotted in the chart/ graph. Each data series in a chart is shown in a unique colour or pattern or both. Its identification is given by the legend. There may be more than one data series in a chart/graph. |