CUET Preparation Today
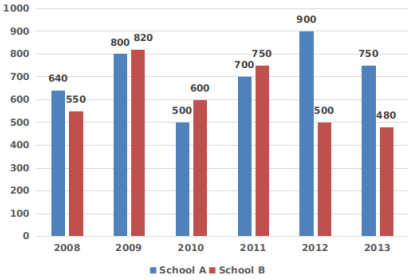
The given bar graph shows the number of students of two schools over a period of six years.
In the bar graph, what is the ratio of the students taken for years the 2008, 2012, 2013 together from school A to the students taken for the years 2009, 2010, 2011 together from school B? |
118 : 251 229 : 217 251 : 118 217 : 229 |
229 : 217 |
Students of A in 2008 , 2012 , 2013 : students of B in 2009 , 2010 , 2011 ( 640 + 900 + 750 ) : ( 820 + 600 + 750 ) 2290 : 2170 229 : 217 |