CUET Preparation Today
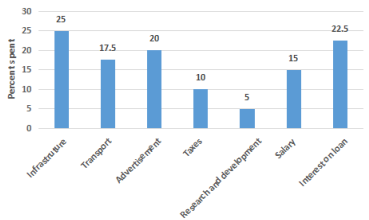
The given graph represents the percentage distribution of the total expenditure of a company. Study the graph and answer the question that follows.
What is the ratio of the total expenditure on ‘Infrastructure’ and 'Transport' to the total expenditure on 'Taxes' and ‘Interest on Loans'? |
15 : 13 17 : 13 16 : 13 14 : 13 |
17 : 13 |
Total expenditure on ‘Infrastructure’ and 'Transport' : Total expenditure on 'Taxes' and ‘Interest on Loans' ( 25 + 17.5 ) : ( 10 + 22.5 ) 42.5 : 32.5 17 : 13 |