CUET Preparation Today
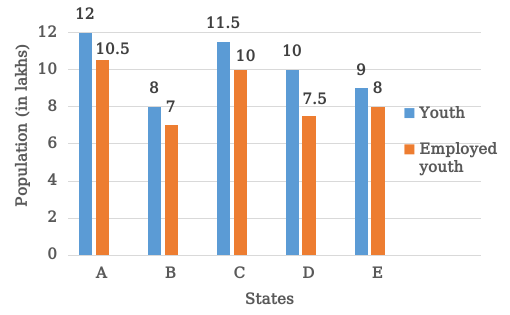
The following bar graph shows the total number of youth (in lakhs) and the number of employed youth (in lakhs) in 5 states A, B, C, D and E. What is the ratio of the number of youth in states A, C and E taken together to the number of employed youth in states B, C and D taken together?
|
65 : 59 65 : 49 8 : 7 57 : 49 |
65 : 49 |
Number of youth in A , C & E : Number of employed youth in B , C & D (12 + 11.5 + 9) : (7 + 10 + 7.5) 32.5 : 24.5 65 : 49 |