CUET Preparation Today
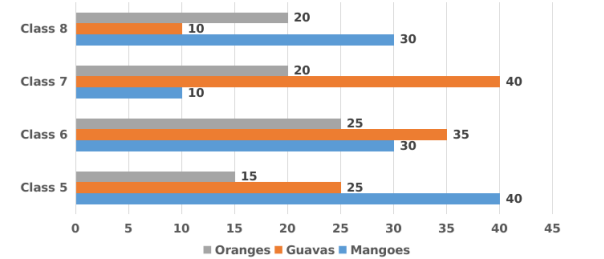
The following bar graph shows the data of the number of students of different classes who like to eat different types of fruits.
Find the ratio of the number of students from class 7 who like guavas to the number of students from Class 5 who like mangoes.
|
5 : 7 1 : 1 2 : 1 1 : 2 |
1 : 1 |
Number of students from class 7 who like guavas : Number of students from Class 5 who like mangoes 40 : 40 1 : 1 |