CUET Preparation Today
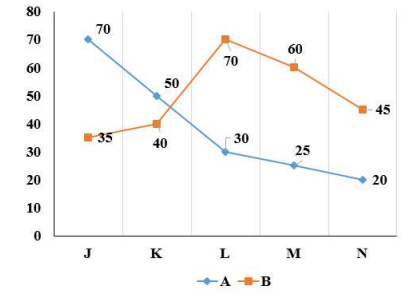
The line chart given below shows production of sugar by two companies A and B in 5 years.
Which of the following statement is correct? I. The production of sugar by A in years J and K together is 7.69 percent more the production of sugar by B in year L and M together. II. The ratio of combined production of sugar by B in years M and N to the combined production of sugar by A in years K and L is 21 : 16. |
Only II Neither I nor II Both I and II Only I |
Only II |
I. The production of sugar by A in years J and K together is 7.69 percent more the production of sugar by B in year L and M together. Production of A by J & K = 70 + 50 = 120 Production of B in L & M = 70 + 60 = 130 Required percentage = \(\frac{120 - 130}{130}\) × 100 = - 7.69% Production in A in J & K is 7.69% less than production by B in L & M Statement I is not correct. II. The ratio of combined production of sugar by B in years M and N to the combined production of sugar by A in years K and L is 21 : 16. Production of B in M & N : Production of A in K & L ( 60 + 45 ) : ( 50 + 30 ) 105 : 80 21 : 16 Statement II is correct. ANs :- Only II |