CUET Preparation Today
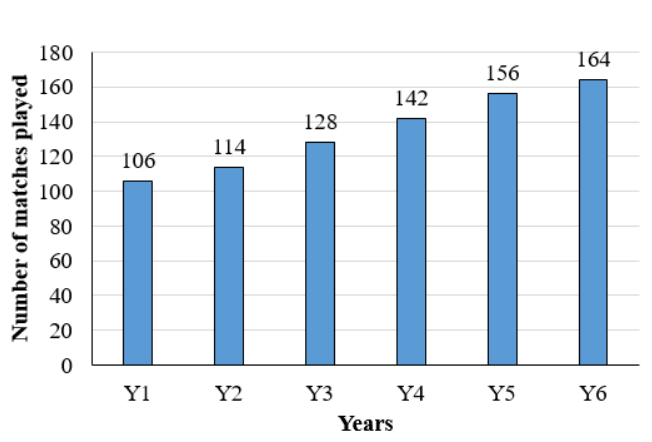
The following bar chart shows the number of matches played by a team in 6 consecutive years .
The number of matches played in Y7 will be equal to the average number of matches played in Y3 and Y4. The number of matches played in Y8 will be 20% more than the number of matches played in Y7. How many matches will be played by the team in Y8? |
156 152 168 162 |
162 |
20% = \(\frac{1}{5}\) ATQ, Number of matches played in Y7 = \(\frac{128 + 142 }{2}\) = 135 Now , Number of matches played in Y8 = \(\frac{6}{5}\) × 135 = 162 |