CUET Preparation Today
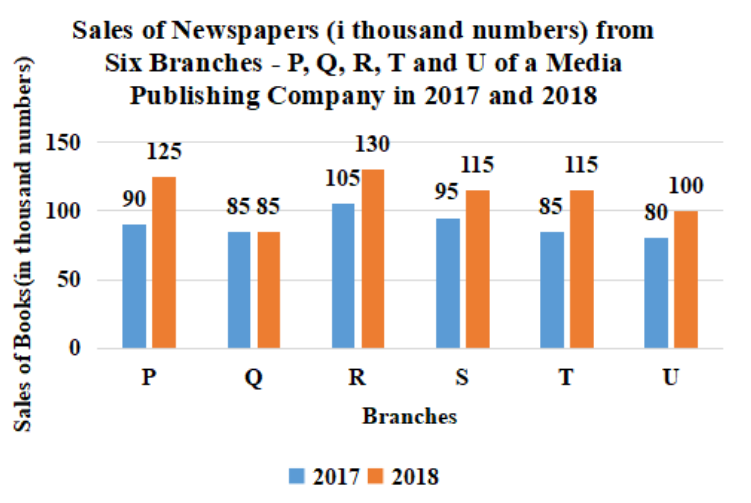
The bar graph given below shows the sales of Newspapers (in lakh number) from six branches of a Media Publication Company during two consecutive years 2017 and 2018.
Total Sales of U for both the years is what percent (correct to one place of decimal) of the combined Sales of the branches Q and R for 2017 and 2018? |
48.6% 67.1% 44.4% 41.0% |
44.4% |
Total sale of U for both the years = 80 + 100 = 180 Total sale of Q & R for both the years = (85 + 85) + (105 + 130) = 405 Required percentage = \(\frac{180}{405}\) × 100 = 44.4% |