CUET Preparation Today
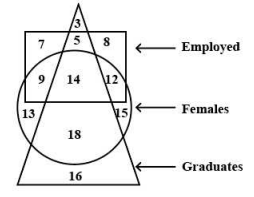
In the given diagram, the shapes indicate the categories of persons. The numbers given in the different segments represent the number of persons in that category. How many females are either graduates or employed but NOT both ?
|
39 40 35 41 |
39 |
Step 1 ) Look at the figure of Triangle , circle and Square Step 2) Look at number given in the figure as the females are either graduates or employed but NOT both Step 3) By visual observations we conclude that (9+ 12 + 18 = 39 ) is the number which represents the females are either graduates or employed but NOT both |