CUET Preparation Today
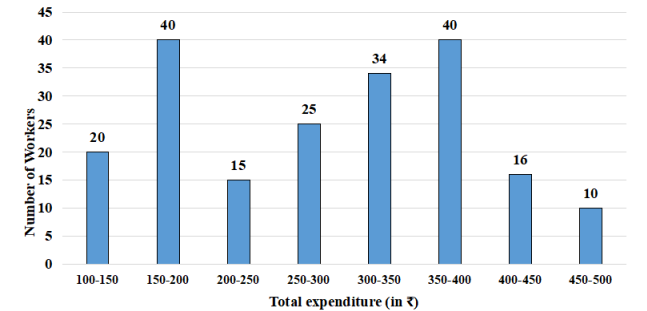
The following histogram represents the distribution of household expenditure (in ₹) of 200 manual workers in a city.
The ratio of the number of workers whose household expenditure is less than 200 to the number of workers whose household expenditure is ₹300 and above is: |
3 : 5 2 : 5 4 : 5 3 : 4 |
3 : 5 |
Number of workers with household expenditure less than Rs.200 : Number of workers with household expenditure less than Rs.300 ( 20 + 40 ) : ( 34 + 40 + 16 + 10 ) 60 : 100 3 : 5 |