CUET Preparation Today
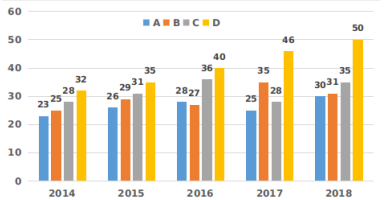
The following bar graph shows the data of the production of an item (in thousand tonnes) from four different companies A, B, C and D during the years mentioned.
In the five years given, the average production is highest in company ......... and lowest in company .........., respectively. |
C; A D; A A; B B; C |
D; A |
In A , Average production of A = \(\frac{23 + 26 + 28 + 25+30}{5}\) = \(\frac{ 132}{5}\) = 26.4 In B , Average production of B = \(\frac{25+29+27+35+31}{5}\) = \(\frac{ 147}{5}\) = 49 In C , Average production of C = \(\frac{28+31+36+28+35}{5}\) = \(\frac{ 158 }{5}\) = 31.6 In D , Average production of D = \(\frac{32+35+40+46+50}{5}\) = \(\frac{ 355}{5}\) = 71 So , Average is highest of company D i.e. 71 and lowest of company A i.e. 26.4 . Ans :- D ; A |