CUET Preparation Today
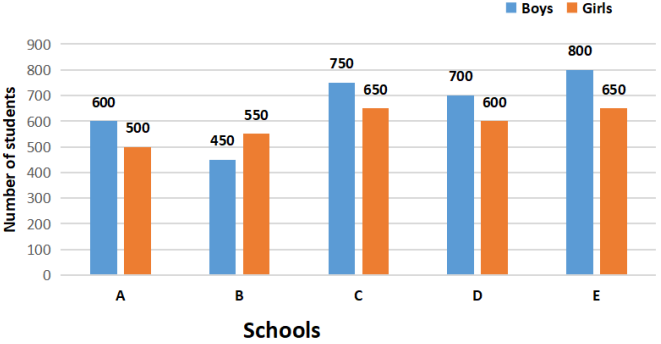
The given bar graph represents the number of boys and girls in five different schools. Read the graph and answer the question that follows.
In which school is the percentage of boys more than 55%? |
E B C A |
E |
Percentage of boys in school A = \(\frac{600}{1150}\) × 100 = 52.17% Percentage of boys in school B = \(\frac{450}{1000}\) × 100 = 45% Percentage of boys in school C = \(\frac{750}{1400}\) × 100 = 53.57% Percentage of boys in school D = \(\frac{700}{1300}\) × 100 = 53.84% Percentage of boys in school E = \(\frac{800}{1450}\) × 100 = 55.17% School E has percentage of boys more than 55% i.e. 55.17%
|