CUET Preparation Today
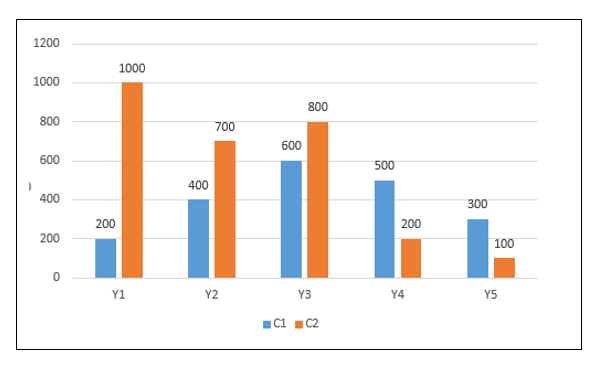
The bar graph given below shows the sales of two companies C1 and C2 in 5 years.
J1 = The average sale of company C1 in year Y1. Y2 and Y3. J2 = The difference between total sale of company C1 and C2 in all the 5 years. What is the value of (J2/J1)? |
4 2 3 1 |
2 |
J1 = The average sale of company C1 in year Y1. Y2 and Y3 = \(\frac{200 + 400 + 600}{3}\) = 400 J2 = The difference between total sale of company C1 and C2 in all the 5 years = (200+400+600+500+300) - (1000+700+800 +200 +100) = 2000 - 2800 = - 800 = 800 ( Difference is always positive ) Now , \(\frac{J2}{J1}\) = \(\frac{800}{400}\) = 2 |