CUET Preparation Today
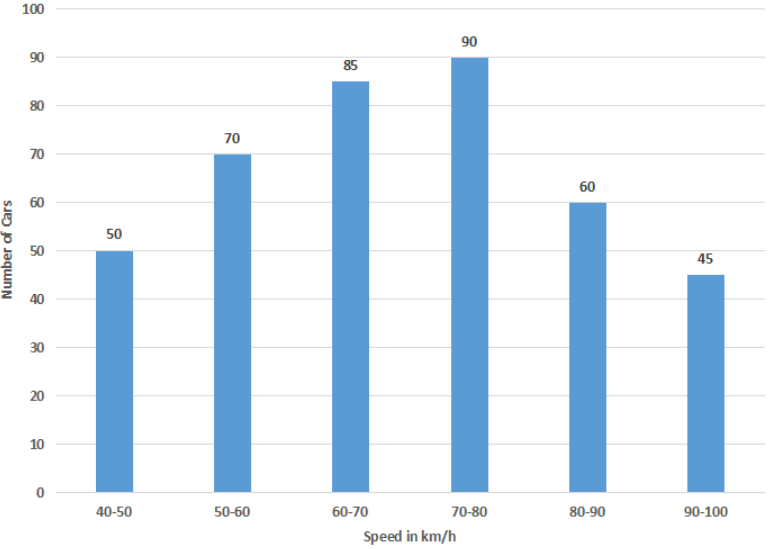
The given histogram shows the frequency distribution of the speed of cars passing though at a particular spot on a highway. Study the graph and answer the question that follows.
What is the ratio of the number of cars with speed less than 60 km/h to the number of cars with speed more than 80 km/hr? |
8 : 7 4 : 5 5 : 4 7 : 8 |
8 : 7 |
Cars with speed less than 60 km/h : Cars with speed more than 80 km/h ( 50 + 70 ) : ( 60 + 45 ) 120 : 105 8 : 7 |