
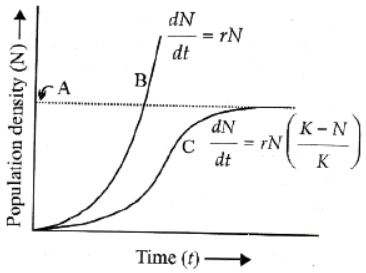
Which is correctly labelled with respect to the given diagram?
Answer & explanation
Correct answer: option 3
The correct answer is Option (3) -A : Carrying capacity.
Logistic growth: A population growing in a habitat with limited resources show initially a lag phase, followed by phases of acceleration and deceleration and finally an asymptote, when the population density reaches the carrying capacity. A plot of N in relation to time (t) results in a sigmoid curve. This type of population growth is called Verhulst-Pearl Logistic Growth. yeast is an example of logistic growth curve and is described by the following equation:
\(\frac{dN}{dt}\) = rN(\(\frac{K-N}{K}\))
Where N = Population density at time t, r = Intrinsic rate of natural increase, K = Carrying capacity.
Population growth curve
B when responses are not limiting the growth, plot is exponential,
C when responses are limiting the growth, plot is logistic,
A is carrying capacity