CUET Preparation Today
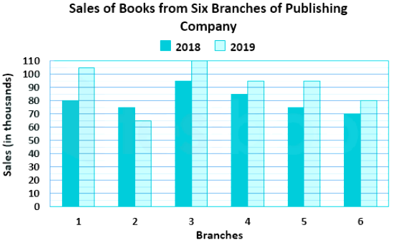
The following bar graph shows the sales of books (in thousands) from six branches of a publishing company during two consecutive years 2018 and 2019.
What is the average sales of all the branches (in thousands) for the year 2018? |
84 78 80 86 |
80 |
Total sale of all the branches in year 2018 = 80 + 75 + 95 + 85 + 75 + 70 = 480 Average of sale of all the branches in year 2018 = \(\frac{480}{6}\) = 80 |