CUET Preparation Today
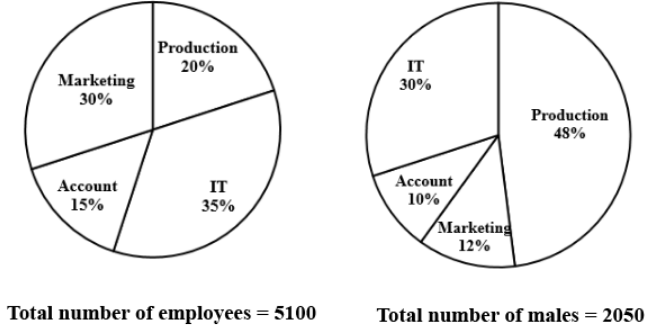
The following pie charts show the percentage of employees in each department and the percentage of males working in each department.
Find the number of females working in the production department. |
36 40 32 24 |
36 |
20% = \(\frac{1}{5}\) & 48% = \(\frac{12}{25}\) Total employees in production = \(\frac{1}{5}\) × 5100 = 1020 Total number of male employee in production = \(\frac{12}{25}\)×2050 = 984 Number of female employee = 1020 - 984 = 36 |