CUET Preparation Today
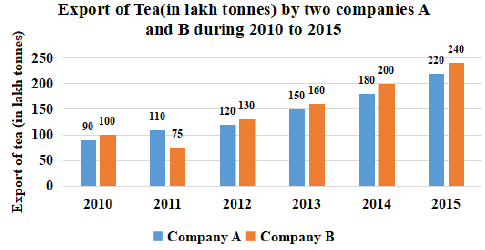
The following Bar Graphs represent the Export of Tea (in lakh tonnes) by two companies A and B during the years 2010 to 2015. Study the chart and answer the question written below:
What is the ratio of the total exports of company B in 2011 and 2014 to the total exports of company A in 2012 and 2015? |
55 : 68 68 : 55 29 : 37 37 : 29 |
55 : 68 |
Export of B in 2011 & 2014 : Export of A in 2012 & 2015 ( 75 + 200 ) : ( 120 + 220 ) 275 : 340 55 : 68 |