CUET Preparation Today
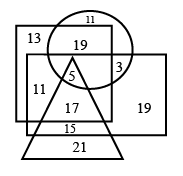
The given Venn diagram represents results of a class of students: The triangle represents students who scored 85% and above in Maths, the circle represents students who scored 85% and above in English, the rectangle represents students who scored 85% and above in Science, and the square represents students who scored 85% and above in Social Sciences. The numbers given in the diagram represent the number of students in that particular category.
How many students scored 85% and above in all the subjects? |
11 5 15 17 |
5 |
The triangle represents students who scored 85% and above in Maths The circle represents students who scored 85% and above in English The rectangle represents students who scored 85% and above in Science The square represents students who scored 85% and above in Social Sciences
Step 1 ) Look at the figure of rectangle , Triangle , circle and square Step 2) Look at number common in all who meet all the above criteria that is scored 85% and above in all the subjects Step 3) By visual observations we conclude that 5 is the number who meet all the above criteria that is scored 85% and above in all the subjects interview |