CUET Preparation Today
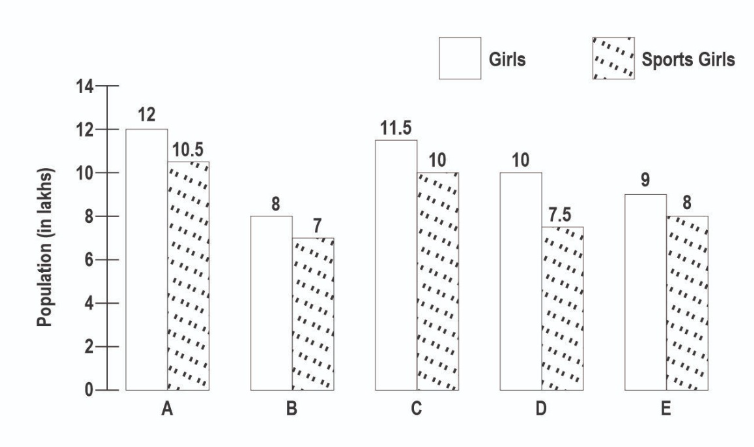
The following bar graph shows the total no. of Girls (in lakhs) and the no. of Sports Girls (in lakhs) in 5 States A, B, C, D and E.
Which state(s) has sports girls less than 80% of its total no. girls? |
B D B and D C and D |
D |
Sports girls in all five states, A = \(\frac{105}{120}\) × 100 = 87.5% B = \(\frac{7}{8}\) × 100 = 87.5% C = \(\frac{10}{11.5}\) × 100 = 95% D = \(\frac{75}{100}\) × 100 = 75% E = \(\frac{8}{9}\) × 100 = 88\(\frac{8}{9}\)% So, State D has less than 80% of sports girls. |