CUETMOCK
  • Pricing
  • Mentors
Log inStart freeStart free mocks→

First test, then trust

Try a free CUET mock test.

Join 5,00,000+ students who rehearsed exam day on the exact NTA screen before sitting CUET. On the web and on Android.

Start free mocks →Get the Android app
CUETMOCK

India's #1 CUET Mock Test Platform. Original NCERT-based questions on the exact NTA exam screen — trusted by 5,00,000+ students since CUET 2022.

Get it onGoogle PlayScan to download the CUETMOCK app

Mock tests

  • CUET mock test series
  • Browse all papers
  • Commerce mocks
  • Humanities (Arts) mocks
  • Science mocks
  • Languages & GAT mocks
  • Free practice questions
  • Pricing

Resources

  • CUET exam guide
  • CUET syllabus
  • Universities accepting CUET
  • Expert blogs
  • News & notifications
  • Webinars & counselling
  • CUET score calculator
  • How we estimate your rank
  • FAQs

Company

  • About us
  • Our leadership & team
  • Our toppers
  • Mentors
  • For schools
  • Contact us
  • Terms
  • Privacy
  • Refund policy

Talk to us

+91 7696 6630 56info@cuetmock.comWhatsApp us

Our other platforms

  • JEE Mock — For IIT-JEE aspirants
  • NEET Mock — For NEET aspirants

Newsletter

Exam updates, study material and offers — no spam.

© 2026 NYC Ventures Pvt. Ltd.

701-702, Royal Business Park, Zirakpur, Punjab - 140603

  • Terms of use
  • Privacy policy
  • Refund policy
  • Contact us

iCUETMOCK is an independent preparation platform, not affiliated with the National Testing Agency (NTA). Always check exam details on the official NTA website.

  • Home
  • Mock tests
  • CUET guide
  • Pricing
  • Log in
Home/Practice questions/Economics
EconomicsMacro Economics: Determination of Income and Employment

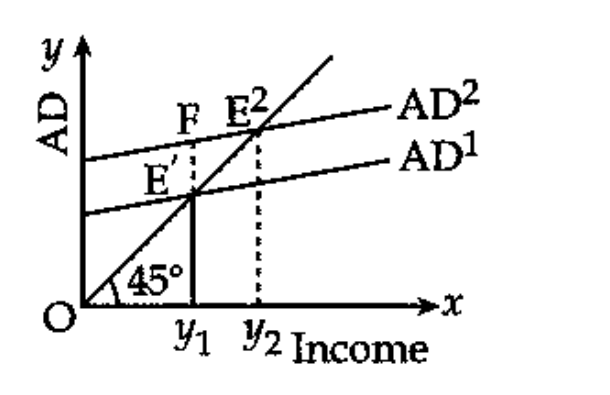
The gap E'F in the diagram indicate ______________.

Based on the following diagram answer the question :
diagram

The gap E'F in the diagram indicate ______________.

Answer & explanation+

Correct answer: option 3

The correct answer is Option (3) → Excess demand

At income y1, output is shown by point E′, where AD1 meets the 45° line. After AD rises to AD2, planned spending at y1 is shown by point F. Spending is more than output by E′F.

This gap is the excess demand that the rise in autonomous spending creates.

  • Option (1) Deficient demand — Incorrect. Demand is deficient when it is not enough to employ all the factors of production, so equilibrium output is below the full employment level. Here AD2 lies above the output at y1.

  • Option (2) Equilibrium income — Incorrect. Equilibrium income is a level of income, such as y1 or y2, where AD equals output. E′F is a vertical gap between demand and output.

  • Option (3) Excess demand — Correct. E′F measures how much planned spending exceeds output at y1.

  • Option (4) Full employment level of output — Incorrect. This is the level of output at which all factors are employed. It is a level of income on the income axis, not a gap.

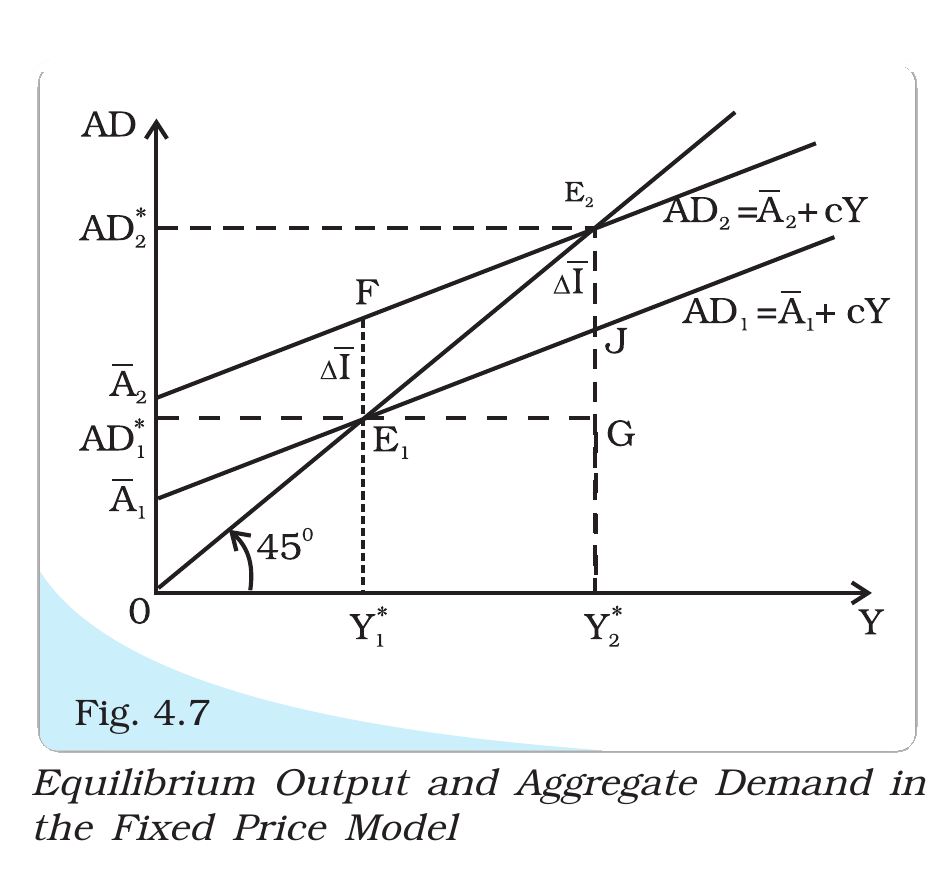
NCERT (2026-27): “4.3.2 Effect of an Autonomous Change in Aggregate Demand on Income and Output … When autonomous investment increases, the AD1 line shifts in parallel upwards and assumes the position AD2. The value of aggregate demand at output Y1* is Y1*F, which is greater than the value of output 0Y1* = Y1*E1 by an amount E1F. E1F measures the amount of excess demand that emerges in the economy as a result of the increase in autonomous expenditure. Thus, E1 no longer represents the equilibrium.…

4.4 Some More Concepts … The equilibrium level of output may be more or less than the full employment level of output. If it is less than the full employment of output, it is due to the fact that demand is not enough to employ all factors of production. This situation is called the situation of deficient demand. It leads to decline in prices in the long run. On the other hand, if the equilibrium level of output is more than the full employment level, it is due to the fact that the demand is more than the level of output produced at full employment level. This situation is called the situation of excess demand. It leads to rise in prices in the long run.”

NCERT extract

Advertisement

Practise more on Macro Economics: Determination of Income and Employment

Chapter-wise mocks on the real NTA exam screen, with solutions and your rank. Your first mocks are free.

Start free mocks →

Advertisement

Next questions

  1. Re-arrange the phrases into a meaningful sentence. A. near my houseB. livesC. the boyD. wearing the green shirt Choose the correct answer f…English · Arrange in Meaningful Sequence
  2. Assertion : EcoRI comes from Escherichia coli RY 13. Reason : In EcoRI, the letter ‘R’ is derived from the name of genus.Biology · Biotechnology -Principles and Processes
  3. Consider the linear programming problem Maximise z=3x+y subject to constraints x+y ≤ 6, x ≥ 0, y ≥ 0 . Which of the following statements ar…Maths. Section B1 · Linear Programming
  4. Which of the following objects has more inertia than others?General Aptitude Test · General Knowledge
  5. Assertion (A) : Sodium lamps are used in foggy conditions. Reason (R) : Yellow light is scattered more during its passage through the fog.Physics · Electromagnetic Waves
  6. Which of the following is a measure to calculate "Poverty" in India?Economics · Indian Economic Development: Poverty
  7. In a test, Arun scored 12 marks more than Bina. Bina scored 5 marks less than Chirag. Deepa scored 3 marks more than Chirag, and Esha score…General Aptitude Test · Verbal Reasoning
  8. Select the option that is related to the third word in the same way as the second word is related to the first word. (The words must be con…General Aptitude Test · General Ability
  9. In an ac circuit, a coil of self-inductance L is connected in series with an electric bulb of resistance R. If the frequency of ac supply i…Physics · Alternating Current
  10. Consider the following Entrepreneurial competencies. (A) Problem Solving(B) Emotional Connect(C) Self Esteem(D) Assertiveness(E) Persuasion…Business Studies · Entrepreneurship Development