CUET Preparation Today
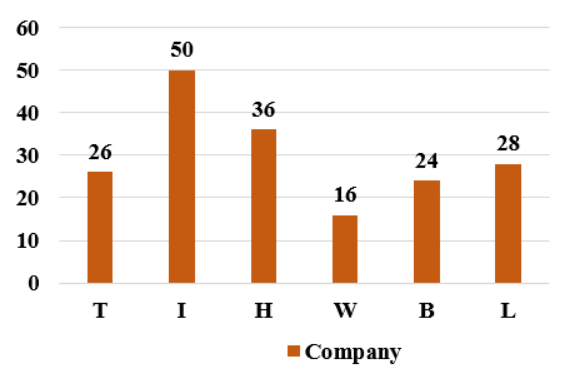
Study the given bar-graph and answer the question that follows. The bar-graph shows the number of students from a college who got placed in six companies in 2020.
If 60 students from the college did not get a job in any of these six companies, then what percentage of the students from this college were placed in H in 2020? |
20% 12.5% 22% 15% |
15% |
Total number of students = 26 + 50 + 36 + 16 + 24 + 28 + 60 = 240 Number of students placed in H = 36 Required percentage = \(\frac{36}{240}\) × 100 = 15% |