CUET Preparation Today
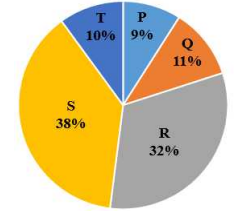
The pie chart given below show the runs scored by 5 batsmen in a cricket match. Total runs scored by these batsmen are 500, Runs scored by a batsman is shown as a percentage of runs scored by all these five batsmen.
How many runs are scored by the batsman R? |
120 160 200 90 |
160 |
Runs scored by R = \(\frac{32}{100}\) × 500 = 160 |