CUET Preparation Today
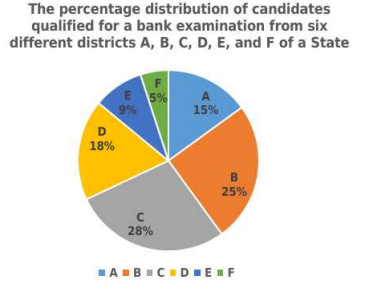
Study the given pie-chart and answer the question that follows. The pie-chart represents the percentage distribution of candidates qualified in a bank examination from six different districts of a State in 2016. The total number of qualified candidates from the State is 68000.
What is the difference (to the nearest whole number) between the average number of qualified students from the Districts A. C and F and the average number of qualified students from the Districts B, D and E? |
906 910 900 907 |
907 |
Average number of qualified students from the Districts A, C and F = \(\frac{1}{3}\) × \(\frac{15+28+5 }{100}\) × 68000 = \(\frac{1}{3}\) × \(\frac{48 }{100}\) × 68000 = 10880 Average number of qualified students from the Districts B, D and E = \(\frac{1}{3}\) × \(\frac{25+18+9}{100}\) × 68000 = \(\frac{1}{3}\) × \(\frac{ 52 }{100}\) × 68000 = 11786.67 Required difference = 11786.67 - 10880 = 906.67 = 907 ( to the nearest whole number) |