CUET Preparation Today
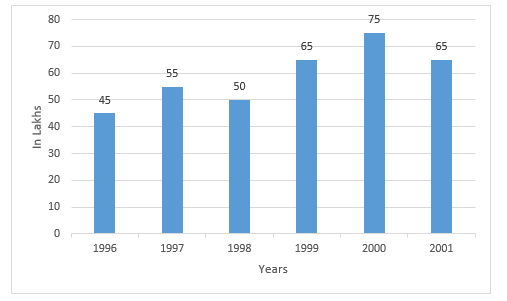
The following graph given the annual percent profit earned by a company during the period 1996-2001. Study the graph carefully and answer the question that follow. %$Profit=\frac{Income \, - \, Expenditure}{Expenditure}×100$
The period in which the profit of the company has increased fasted is : |
1998 - 1999 1997 - 1998 2000 - 2001 1996 - 1997 |
1998 - 1999 |
Lets solve one by one for each option. 1. 1998 - 1999 Increase in profit = \(\frac{65-50 }{50}\) × 100 = 30% 2. 1997 - 1998 There is decrease in profit . 3. 2000 - 2001 There is decrease in profit . 4. 1996 - 1997 Increase in profit = \(\frac{55-45 }{45}\) × 100 = 22.22% So , Percentage increase in profit is maximum in 1998 - 1999 |