CUET Preparation Today
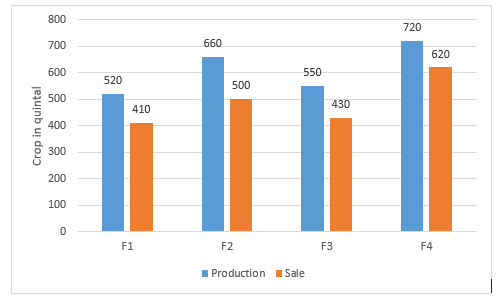
The given bar graph represents the production and sales of a certain crop in quintals by the farmers F1,F2, F3 and F4.
What is the average of a crop in quintals, sold by the all farmers? |
470 490 510 530 |
490 |
Total sale of all farmers = 410 + 500 + 430 + 620 = 1960 Average of sale = \(\frac{1960 }{4}\) = 490 |