CUET Preparation Today
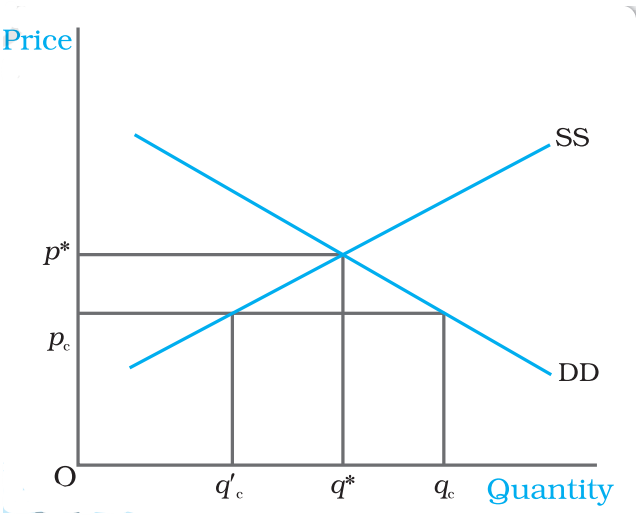
Diagram shows excess demand at price _______ and equilibrium at price_______.
|
p*, pc pc, p* pc, pc p*, p* |
pc, p* |
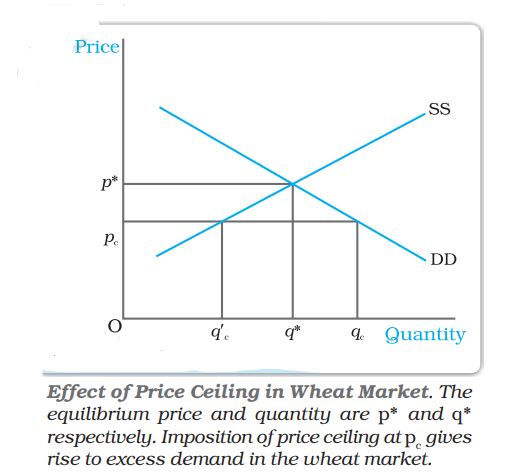
The correct answer is Option 2: pc , p* The equilibrium price and quantity of wheat are p* and q* respectively. When the government imposes price ceiling at $p_C$ which is lower than the equilibrium price level, there will be an excess demand for wheat in the market at that price. The consumers demand $q_c$ kilograms of wheat whereas the firms supply $q'_c$ kilograms. Thus, Excess demand exists at price pc and equilibrium is at price p*.
|