
Study the graph below, which shows the consumption line CC′ and the saving line SS′, and answer the questions that follow.
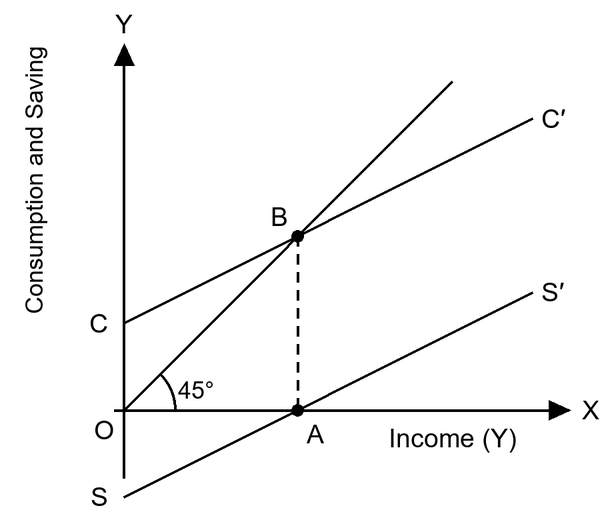
At positive levels of income below OA, which of the following is true?
Answer & explanation
Correct answer: option 1
The correct answer is Option (1) → Saving is negative and APC is greater than 1
Below income OA, the saving line SS′ lies below the horizontal axis, so saving is negative. People consume more than their income, so APC = C / Y is greater than 1.
Option (1) Saving is negative and APC is greater than 1 — Correct. C > Y gives S < 0 and C / Y > 1.
Option (2) Saving is positive and APC is less than 1 — Incorrect. This is true only above income OA.
Option (3) Saving is zero and APC is equal to 1 — Incorrect. Zero saving and APC = 1 hold only at income OA.
Option (4) Saving is negative and APC is less than 1 — Incorrect. When saving is negative, C is above Y, so APC is more than 1.
NCERT (2026-27): “4.1.1 Consumption The most important determinant of consumption demand is household income. A consumption function describes the relation between consumption and income. The simplest consumption function assumes that consumption changes at a constant rate as income changes. Of course, even if income is zero, some consumption still takes place. Since this level of consumption is independent of income, it is called autonomous consumption. …” “4.1.1 Consumption … Let us also look at another dimension of this, savings. Savings is that part of income that is not consumed. … We define the marginal propensity to save (MPS) as the rate of change in savings as income increases. …” “Some Definitions Average propensity to consume (APC): it is the consumption per unit of income i.e., C/Y.” |