CUET Preparation Today
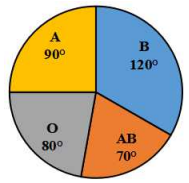
Study the given pie-chart and answer the question that follows. The pie-chart shows the data for A, B, O , AB blood groups of 240 donors.
The ratio of the donors of blood group 'O' to the average of the donors of groups 'A' and 'AB' is: |
1 : 3 1 : 1 1 : 2 2 : 1 |
1 : 1 |
Ratio of donors of blood group 'O' : Average of the donors of groups 'A' and 'AB' 80º : \(\frac{90º +20º }{2}\) 160º : 160º 1 : 1
|