
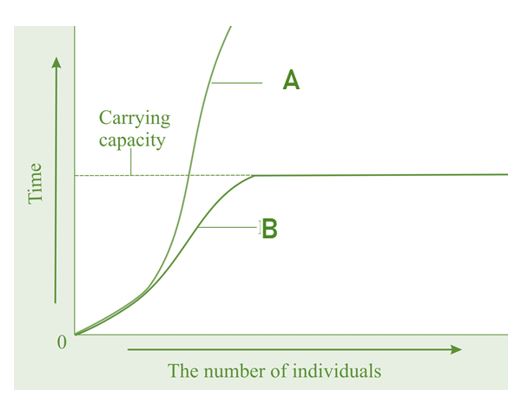
Observe the graph and choose the correct option from following:
Answer & explanation
Correct answer: option 1
The correct answer is Option (1) -
A = \(\frac{dN}{dt}\) = rN.
B = \(\frac{dN}{dt}\) = rN(\(\frac{K-N}{K}\))
A represents 'exponential growth' :
If in a population of size N, the birth rates (not total number but per capita births) are represented as b and death rates (again, per capita death rates) as d, then the increase or decrease in N during a unit time period t (dN/dt) will be
\(\frac{dN}{dt}\)= (b – d) × N
Let (b–d) = r,
then \(\frac{dN}{dt}\) = rN.
The r in this equation is called the ‘intrinsic rate of natural increase’.
B represents 'logistic growth' :
A population growing in a habitat with limited resources show initially a lag phase, followed by phases of acceleration and deceleration and finally an asymptote, when the population density reaches the carrying capacity. A plot of N in relation to time (t) results in a sigmoid curve. This type of population growth is called Verhulst-Pearl Logistic Growth.
= \(\frac{dN}{dt}\) = rN(\(\frac{K-N}{K}\))
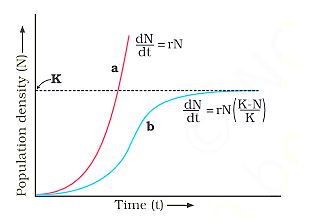
Population growth curve a when responses are not limiting the growth, plot is exponential, b when responses are limiting
the growth, plot is logistic, K is carrying capacity