CUET Preparation Today
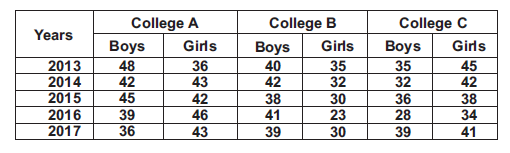
The data given in table shows the no. of boys and girls enrolled 3 different colleges in 5 years.
What is the ratio of no. of Boys in College A in all years to no. of Girls in college in all years? |
1 : 1 2 : 3 4 : 5 7 : 9 |
1 : 1 |
A (2013 - 2017) : A (2013 - 2017) (Boys) (Girls) (48 + 42 + 45 + 39 + 36) : (36 + 43 + 42 + 46 + 43) 210 : 210 1 : 1 |