CUET Preparation Today
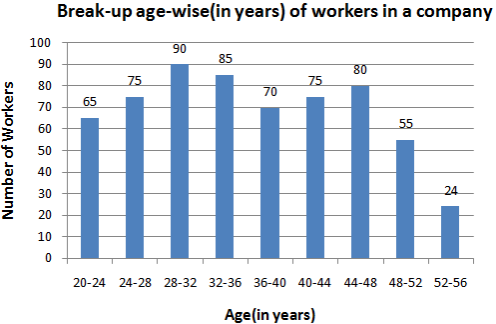
Study the given graph and answer the question that follows.
The number of workers whose age is 36 years or more but less than 48 years is what percentage more than the number of workers whose age is less than 28 years (correct to one decimal point)? |
60.7% 61.2% 62.8% 59.4% |
60.7% |