CUET Preparation Today
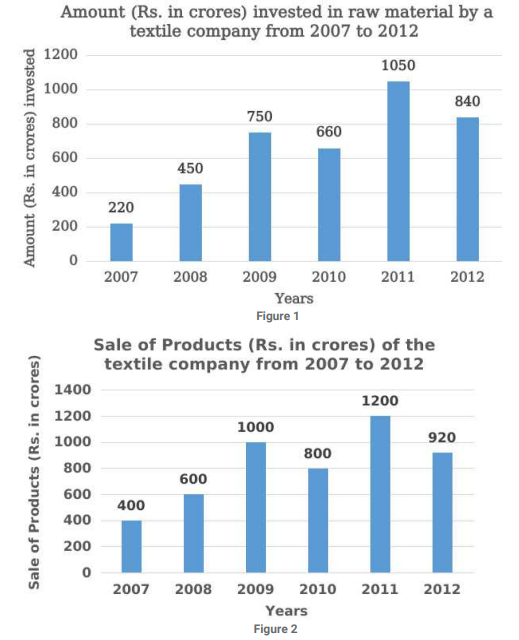
Study the given bar graphs and answer the question that follows. The bar graphs represent the amount invested in raw materials (in ₹ crore) and the sale of the products, by a textile company in the years 2007— 2012. The X-axis represents the years. The Y-axis represents the amount invested in raw materials (in ₹ crore) in figure 1 and sale of products in figure 2, respectively.
In 2011, the sale of products had increased by certain percentage with respect to the previous year. In 2012, by what percent should the sale of products increase from its present value so that it shows the same percent increase as had been shown in 2011? |
94 98 96 95 |
96 |